
- Видео 46
- Просмотров 1 103 024
Skillnator
Канада
Добавлен 4 окт 2011
Skillnator is an online teaching platform.
We want to help professionals and students up skill in their respective fields. We create simple, easy to follow and to the point tutorials on Data Analysis, Data Visualization and programming.
Our goal is to help our students succeed in above areas by providing them best in class training.
We want to help professionals and students up skill in their respective fields. We create simple, easy to follow and to the point tutorials on Data Analysis, Data Visualization and programming.
Our goal is to help our students succeed in above areas by providing them best in class training.
Say Goodbye to Slow Data Refreshes in Power BI!
In this video, we will learn how to combine data from different data sources in Power Query and Power BI.
Many people use the Append feature in Power Query Editor to combine data in Power BI. While this method works well for small datasets or scenarios where you don't need frequent data refreshes, it can lead to long waiting times when dealing with large datasets or dashboards that require regular updates. This is because the Append feature tries to refresh all the data files feeding into the query.
In this video, I will demonstrate a technique to overcome this issue using the UNION function. We will also cover some important considerations to keep in mind when using the UNION function.
I ho...
Просмотров: 123
Видео


Create Impressive PowerPoint Presentations!
Просмотров 1,2 тыс.Год назад
In this video, we will learn how to create 5 amazing PowerPoint presentations using Morph transitions. In addition, we will learn motion path animations, grouping, navigation and many other tips and tricks. 0:00 - Intro 1:32 - Anchor with transparent box hover on agenda slide 9:27 - Anchor various elements of a slide with an arrow shape 12:42 - Float in Float out effect 18:54 - Zoom in Zoom out...

Save time with Power Query!!
Просмотров 4,1 тыс.Год назад
In this video we will learn how power query can help save time by automating repetitive tasks. We will learn how to connect to external data, perform some basic transformations and load data to pivot tables using power query. Timestamps: 00:00 - Intro 02:25 - Connect to external data 05:33 - Power Query Editor interface 07:30 - Basic data transformations 09:46 - Merging data from different file...

Microsoft Excel Tutorial #exceltutorial #exceltips #excelcourse
Просмотров 27 тыс.Год назад
Hi, welcome to our new crash course on Microsoft Excel. This course is for beginners and intermediates who want to advance their skills. We will cover the following: - Navigation, Interface and Ribbon - Statistical Functions - Date Time Functions - Text Functions - Lookup functions - Logical Functions. - Pivot tables - Charts - Shapes - Setting up a modern dashboard Timestamps: 00:00 - Intro 01...

Pivot Tables Crash Course #pivottables #exceltutorial #exceldashboard
Просмотров 14 тыс.Год назад
Hi, welcome to our new crash course on pivot table. In this video we will learn about pivot tables from basic to advance. We will cover following topics: - Pivot table fundamentals. - Slicers and Timelines - Filters and sorting - Customizing pivot tables - Layout setting - Calculated fields and calculated items - Grouping data - Pivot charts - Dashboards with pivot tables Timestamps: 00:00 - In...
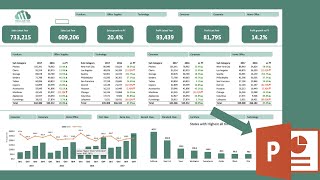
Export excel dashboard to powerpoint in one click #exceltutorial #excelautomation #powerpoint
Просмотров 59 тыс.Год назад
In this video we will learn how to export an excel report to powerpoint in one click. Instagram: skillnator0 Full Excel Playlist: ruclips.net/p/PLzLUxjmulsaVNouPDa1aYJG1I-Doi_qS_ Build Excel dashboard in 5 simple steps: ruclips.net/video/eaSg0mu6nLM/видео.html Timestamps: 00:00 - Intro 02:00 - Set up macro button 02:28 - VBA code to open powerpoint from excel 09:39 - Dynamic forma...

Create interactive excel dashboard in 5 simple steps #exceldashboard #exceltutorial #pivottable
Просмотров 949 тыс.Год назад
In this video we will set up an amazing dashboard in microsoft excel from scratch. We will learn lots of concepts in this video. Some key concepts we will learn are: - Pivot tables / slicers - Data Analysis - Custom formatting - Working with shapes. - Design and colors. Timestamps: 00:00 - Intro 02:00 - Wireframing the dashboard 04:15 - Determine data points required 06:17 - Setting up workings...

Data Shaping and Transformation in tableau #tableau #tableaututorial #tableaufullcourse
Просмотров 481Год назад
In this lecture we will learn how to clean, modify and transform your data in tableau desktop. Instagram: skillnator0 00:00 - Intro 02:25 - Joins and Unions in tableau 09:00 - Creating groups 11:00 - Pivoting columns to rows 14:55 - Outro Link to the full course: ruclips.net/p/PLzLUxjmulsaWmgQao8AIn5Bd9nAIWbPT6 #tableaututorial #tableaudesktop #tableaufullcourse #datacleaning

Create a Tableau dashboard #tableaufullcourse #tableau #tableaudesktop
Просмотров 655Год назад
In this lecture we will set up first full dashboard in tableau. Instagram: skillnator0 Link to the full course: ruclips.net/p/PLzLUxjmulsaWmgQao8AIn5Bd9nAIWbPT6 #tableaututorial #tableaudesktop #tableaufullcourse #tableau #tableau
Tooltips and Labels in tableau #tableaufullcourse #tableau #tableaudesktop
Просмотров 413Год назад
In this lecture we will learn how to use tooltips and labels in tableau. Instagram: skillnator0 Link to the full course: ruclips.net/p/PLzLUxjmulsaWmgQao8AIn5Bd9nAIWbPT6 #tableaututorial #tableaudesktop #tableaufullcourse #tableau #tableau
Maps in tableau #tableaufullcourse #tableau #tableaudesktop
Просмотров 217Год назад
In this video we will learn about maps in tableau. Instagram: skillnator0 Link to the full course: ruclips.net/p/PLzLUxjmulsaWmgQao8AIn5Bd9nAIWbPT6 #tableaututorial #tableaudesktop #tableaufullcourse #tableau #tableau
Bubble Chart and Treemaps in Tableau #tableaufullcourse #tableau
Просмотров 262Год назад
In this lecture we learn about bubble charts and treemaps in tableau. 0:00 - Bubble Charts in tableau 3:00 - Treemaps in tableau Instagram: skillnator0?igshid=YmMyMTA2M2Y= Link to the full course: ruclips.net/p/PLzLUxjmulsaWmgQao8AIn5Bd9nAIWbPT6 #tableaututorial #tableaudesktop #tableaufullcourse #tableau #tableau
Scatter Plots in tableau #tableau #tableaufullcourse #tableauvisualization
Просмотров 199Год назад
Scatter Plots in tableau #tableau #tableaufullcourse #tableauvisualization
Line Charts #tableau #tableaufullcourse #tableauvisualization
Просмотров 253Год назад
Line Charts #tableau #tableaufullcourse #tableauvisualization
Pie chart, bar chart and column chart #tableau #tableaufullcourse #tableaututorial
Просмотров 228Год назад
Pie chart, bar chart and column chart #tableau #tableaufullcourse #tableaututorial
Tableau Full Course Lecture 9 - Highlight Tables
Просмотров 285Год назад
Tableau Full Course Lecture 9 - Highlight Tables
Tableau Full Course Lecture 8 - Heat Maps in Tableau
Просмотров 344Год назад
Tableau Full Course Lecture 8 - Heat Maps in Tableau
Tableau Full Course Lecture 7 - Create text table in tableau and learn basic formatting
Просмотров 200Год назад
Tableau Full Course Lecture 7 - Create text table in tableau and learn basic formatting
Tableau Full Course Lecture 6 - Types of charts in tableau
Просмотров 196Год назад
Tableau Full Course Lecture 6 - Types of charts in tableau
Tableau Full Course Lecture 5 - Exploring worksheet interface and setting up first chart
Просмотров 205Год назад
Tableau Full Course Lecture 5 - Exploring worksheet interface and setting up first chart
Tableau Full Course Lecture 4 - Importance of having right data types
Просмотров 175Год назад
Tableau Full Course Lecture 4 - Importance of having right data types
Tableau Full Course Lecture 3 - Data types in Tableau
Просмотров 275Год назад
Tableau Full Course Lecture 3 - Data types in Tableau
Tableau Full Course Lecture 2 - Connecting to data in tableau
Просмотров 367Год назад
Tableau Full Course Lecture 2 - Connecting to data in tableau
Tableau Full Course Lecture 1 - Course requirements, Installation and First Chart
Просмотров 737Год назад
Tableau Full Course Lecture 1 - Course requirements, Installation and First Chart
Excel statistical functions max(), min(), large(), small()
Просмотров 1,2 тыс.Год назад
Excel statistical functions max(), min(), large(), small()
Statistical functions in excel - rounding, ceiling and others
Просмотров 1,5 тыс.Год назад
Statistical functions in excel - rounding, ceiling and others
Excel custom toolbar and secret to memorizing keyboard shortcuts
Просмотров 1,8 тыс.Год назад
Excel custom toolbar and secret to memorizing keyboard shortcuts
Create amazing excel reports - build navigation features with hyperlinks
Просмотров 3,3 тыс.Год назад
Create amazing excel reports - build navigation features with hyperlinks
Amazing... Love this ❤
@Skillnator Thank you walking us through such informative dashboard. I tried replicating the same. I have facing an issue with Slice + Text box at top. I am having to reconfigure the formula every time. Although it setup as dynamic, When i open file next time and try to check filters- the data remains same. only after i reconfigure the cell does the text box become dynamic. Is there any way to fix this issue ?
❤
VBA PROGRAMMING COURSE PLEASE
Can you share the data set
How can i get the dataset ?
Is all the functionality on your dashboard available on the online version of excel? I'm having trouble using text boxes with dynamic cell references while using the online version. Are dynamic text boxes limited to desktop excel?
Very nice 👍👍👍
Excellent presentation
Pls, I have been trying to use the developer tool navigate from top 10 to bottom 10 but my result is always #Spill!…. Pls how can I get to watch the videos step by step for developer tool aspect. Thank you
Thank you very much. I do wish you have good healthy and wealthy forever!!!
wooo thanks very much specials thank for sample file I can follow your video step by step
you are most amazing and brilliant teacher I have ever seen.You give the explanation so clearly.I understand all of steps.Thank you so much.I am really grateful.
Awesome explanation!
Ow did you copy the data off the pivot while it stay linked with the slicer
Awesome job
Where's the code?
Absolutely brilliant
Great
Pls help us with data
This is so awesome
Wow. Thanks for sharing bro. Very informative.
Good work. Switch formul for title is a new idea. Thx
Absolutely amazing.
I really love the switch option, but I also have a slicer by location and some locations dont have any data. Even after modifying my switch formula to not return them it is still showing 0 value in my bar chart. I already tried the "hidden cells" changed to show gaps instead of zeros but I want the chart to resize appropriately based on present values rather than having placeholders when theres only 3 of top 10 values. Is there a way to do this or am I just wishing excel was like Power BI?
Really good ! Why do I get this when linking to Pivot Table cells ?? =GETPIVOTDATA("[Measures].[Count of Rate]",$A$1,"[Append1].[Date]","[Append1].[Date].&[2024-01-09T00:00:00]","[Append1].[TERM]","[Append1].[TERM].&[10 YR ARM]") * I fixed, really odd ! Love the new animation for the Bar and Line charts. I used to code to make that happen ! PS I notice that using interest rate data 6.875% these do not and I cannot make them values using the Import process and TARNSFORM options... really frustrating !
Why not do a video on how you created the Wireframe? Seems like you sped up the process, that's the most important step....
Wire framing is the easy part. Just know your data and what you want to visualize and how you want it set up.
You're awesome bro❤
Which version of excel you are using
You are right , the last part you last part, Normally we did have this kind of cleaned data . Could you make a video and use power query to clean the dataset as this sales dataset?
thanks a lot sir
simply to understand and easy to follow, thank you very much
Good
Thank you so much! Clear explanation and steps.
Wow Fantastic for the first time i have understood PIVOT Tables Thanks! Man
Awesome video and I learned a lot of Excel tricks 🙌🏼
Very informative and useful video i have ever seen so far on excel dashboard
Great Video and Well Explained. The only part i was unable to get it was how you assign roles to Top 10 and Bottom 10 button as video skipped one part I guess around the time stamp 38:00 till 38:55. Please help to clarify. @Skillnator
very nice !!!! thank you
I watched some others too, but this one is excellent!
Hi, what's the shortcut to adapt the slicer size to the content as fast you did (timestamp : 9:20) ?
how you removed all the cells in white background without rows and columns
Go to the VIEW tab, then uncheck "Gridlines"
if only i could like this video a million time! Appreciate the effort to guide us through, it is fantastic and absolutely helpful.
Its an amazing video I learned a lot from it however I have one question its regarding about last 2 minutes(to be precise when the video is on 38.45minutes, how were you able to change the value (number 1 to 2) in option when you were typing the switch and sort, in between typing formula. if its automatic due to formula so its not happing for me
Brilliant, which Font & size you have used
Thanks for Creating us outstanding exposure to dashboard
Excellent teacher
worst contain writer
You teach well. All the relevant aspects are included in your video. Brilliant!!!
Hi .thanks for your wonderful explanation.perfect. Pls I have an assignment ,could you help me out